What Do Patients Really Ask? We Analyzed Nearly 2,500 Conversations

We analyzed 2,452 AI-handled conversations in healthcare facilities: what patients really ask, on which channels, and what it means for the front desk.
Table of Contents
Anyone who works a healthcare reception desk has a ready answer: "they call to book." That is true, but it is only part of the story. Behind almost every ring there is more than one question, often a habit, sometimes a hesitation.
To go beyond intuition, we did something simple: we counted. We analyzed 2,452 conversations handled by Virtual Reception between September 1 and 22, 2026 across several Italian healthcare facilities, on the phone, web chat, and WhatsApp. Each conversation was classified with one or more tags across 19 request categories.
Here is what we found.
The sample in numbers
| Indicator | Value |
|---|---|
| Classified conversations | 2,452 |
| Distinct tags | 19 |
| Unique tag combinations | 311 |
| Average tags per conversation | 2.0 |
| Active channels | 3 (voice, chat, WhatsApp) |
The most important figure is hidden in the "unique combinations" row. With only 19 request types, patients produced 311 different combinations. We will come back to that.
1. The phone is not dead: 9 conversations out of 10
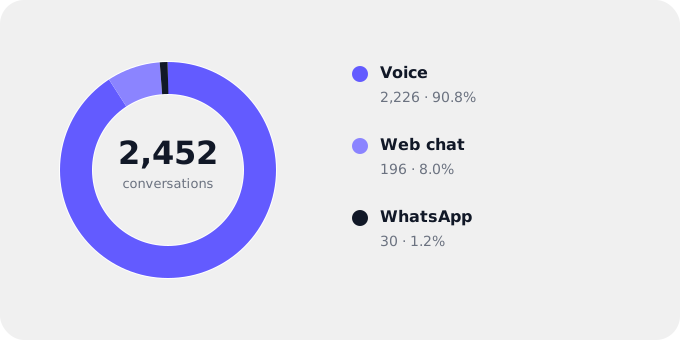
For years the end of phone calls has been announced, replaced by apps, portals, and chat. The data tell a different story:
Voice: 2,226 conversations (90.8%)
Web chat: 196 conversations (8.0%)
WhatsApp: 30 conversations (1.2%)
When health is involved, the Italian patient picks up the phone. Not for lack of alternatives, but because voice offers something an online form does not: the feeling of being heard and of explaining one's case in one's own words.
For a healthcare facility the consequence is direct. The phone channel is not a leftover to switch off: it is the main front door. Every missed call is, in all likelihood, a patient who tries somewhere else.
2. Booking is the main reason, but almost never the only one
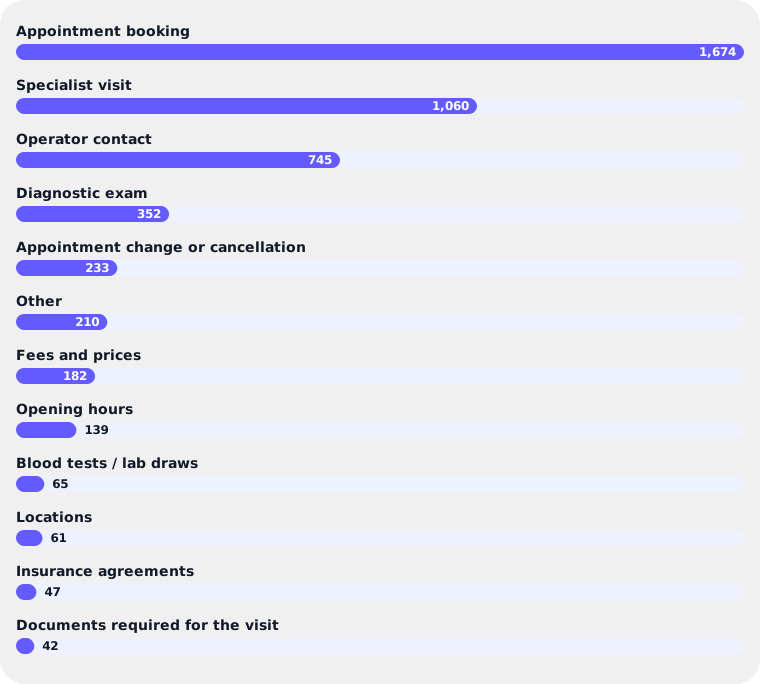
The most frequent tag is no surprise: appointment booking appears in 68.3% of conversations (1,674 out of 2,452). More than two patients in three contact the facility to schedule a visit or an exam.
Another figure is more surprising. Conversations that contain only a booking request are 359, just 14.6%. In the remaining 78.6% of cases the booking arrives with something else: the type of service, a question about price, a request for hours, the wish to speak with someone.
Here is what gets booked:
| Service | Conversations | % of total |
|---|---|---|
| Specialist visit | 1,060 | 43.2% |
| Diagnostic exam | 352 | 14.4% |
| Blood tests / lab draws | 65 | 2.7% |
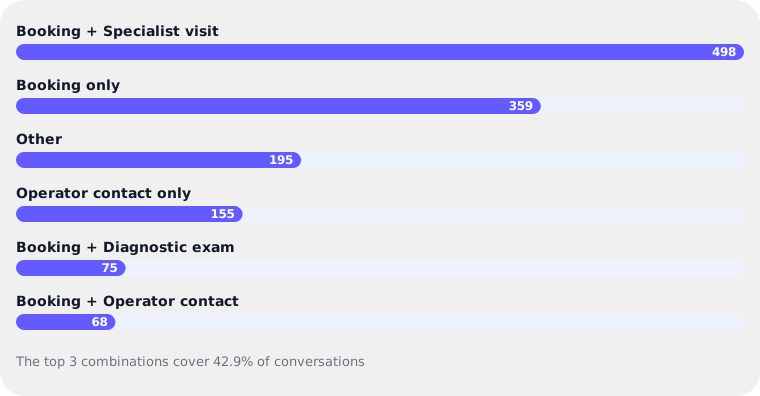
The single most frequent combination is booking + specialist visit: 498 conversations, 20.3% of the total and 22.4% of voice calls alone. This is the heart of a healthcare front desk: finding the right specialist, on the right day, for the right patient.
3. One call, two needs: why "press 1" is no longer enough
On average each conversation contains 2.0 tags. The patient does not call with a single question: they call with a compound need.
"I would like to book a cardiology visit, but first can you tell me how much it costs and whether it is covered by my insurance?"
In a single sentence there are three requests: booking, fees, and insurance agreements. A traditional switchboard would force them into one menu key. The patient would have to choose, call back, then choose again.
The numbers explain why this model has reached the end of the line. 19 request types produced 311 different combinations. No tree of numeric options can predict them all, and no patient wants to navigate them. That is the structural difference we explored in IVR vs Virtual Reception: pros and cons: an IVR routes, a conversational assistant understands and resolves.
At the same time, the top three combinations alone cover 42.9% of conversations. Front-desk demand is extremely varied in its combinations and highly concentrated in its themes. That is the ideal condition for automation: a few well-designed flows handle most of the traffic, and the rest is recognized and directed.
4. "Can I speak to an operator?": the surprising figure
Operator contact appears in 30.4% of conversations (745). At first glance it could look like a signal of distrust toward artificial intelligence. The combinations change the picture.
Only 155 conversations (6.3%) contain exclusively a request for an operator. In the other 590, that is 79.2%, the request to speak with a person arrives together with a concrete need: a booking (68 cases in the most direct combination), a change or cancellation, an exam.
The possible readings differ, and they probably coexist:
Habit: for decades "can you put me through to someone?" was the magic phrase for escaping a voice menu. Many patients say it by reflex, before they have even explained what they want.
Reassurance: on health topics, some patients want to know that a person is there if needed.
Real complexity: some of these requests are cases that must reach an operator, and it is right that they do.
The lesson for a facility is not "remove the operator," but use them where it counts. It is the paradox we described in The AI paradox: the more AI absorbs repetitive requests, the more human time concentrates on the conversations that truly require empathy and judgment.
5. The questions nobody measures
There is a category of requests that rarely shows up in a medical center's reports, because each one, taken alone, weighs little:
| Informational request | Conversations | % of total |
|---|---|---|
| Fees and prices | 182 | 7.4% |
| Opening hours | 139 | 5.7% |
| Locations | 61 | 2.5% |
| Insurance agreements | 47 | 1.9% |
| Documents required for the visit | 42 | 1.7% |
Added together, these tags appear 471 times. They are short, repetitive calls, with answers that never change. Yet in a traditional reception each one occupies a line, blocks an operator, and lengthens the wait for someone trying to book.
Two observations deserve attention. The question "how much does it cost?" appears in nearly one conversation out of 13: price transparency is a real need, and it often comes before the decision to book. These requests are also the simplest to automate fully. In our installations, Virtual Reception resolves 20 to 25% of informational requests on its own.
6. Cancelling matters as much as booking
Appointment change or cancellation appears in 9.5% of conversations (233). Nearly one call in ten is about moving or cancelling something already on the schedule.
It is a figure many facilities underestimate. A cancellation handled in time is a slot that becomes available again for another patient. A cancellation that cannot get through because the line is busy very often becomes a no-show: a specialist's hour lost, and a patient on the waiting list who could have been seen.
Making cancellation easy, however counterintuitive, is one of the most effective levers for protecting revenue. This is where inbound management meets outbound: automatic pre-visit reminders catch cancellations before the patient even has to call.
7. Three channels, three different patients
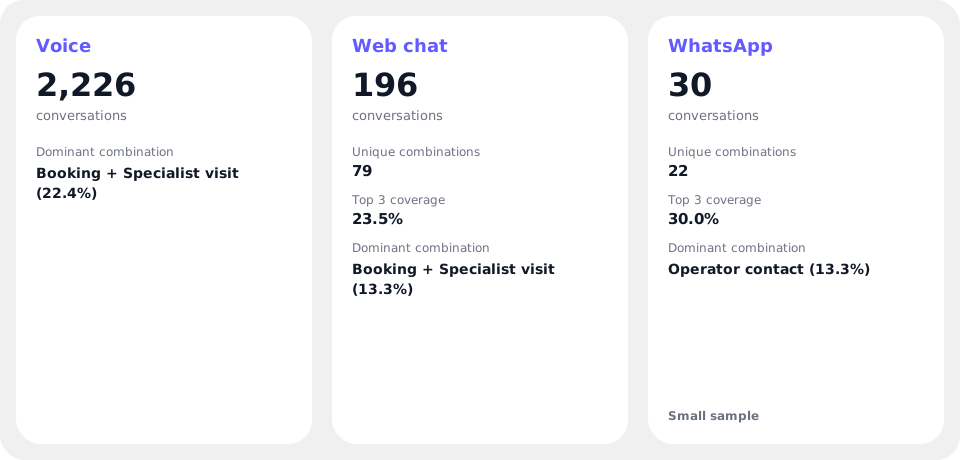
The same 19 tags spread differently depending on the channel. Three "personalities" emerge.
Voice is the channel of decision. It is concentrated: the dominant combination (booking + specialist visit) alone accounts for 22.4% of calls. People who phone already know what they want and want to close it immediately.
Chat is the channel of exploration. Its 196 conversations generate 79 different combinations, almost one every two conversations, against one every eight on the phone. The top three combinations cover only 23.5% of traffic, against 42.9% overall. Someone writing from the website is often still evaluating. The request for locations, which is 6.1% in chat against 2.5% overall, confirms it: chat is 8% of volume but collects about a fifth of all "where are you?" questions.
WhatsApp is the channel of relationship. With 30 conversations the sample is too small for statistical conclusions, but a signal emerges. The most frequent combination is the operator request alone (13.3%), twice the overall average, followed by changing or cancelling a specialist visit (10%). It is a channel used by patients who already have a relationship with the facility and treat it as a direct line. We will monitor it with larger volumes.
For a facility the message is clear: there is no single digital patient. Each channel needs different flows, tone, and goals, while sharing the same integration with the practice management system.
8. The long tail: the 8.6% that escapes the categories
Intellectual honesty requires looking at what does not fit the schema. The tag Other appears in 8.6% of conversations (210), and in 195 cases it is the only tag assigned.
It is the long tail of every front desk: rare requests, out of context, sometimes wrong numbers. It is not a defect to hide but a mine for continuous improvement. Reviewing these conversations regularly reveals new recurring needs, turns them into dedicated categories, and gradually reduces the share of unclassified requests.
What this means for your facility
Put together, the numbers point to five operational implications:
Staff the phone first. With 90.8% of traffic, it is the channel where the patient is won or lost.
Design for compound requests. With an average of 2 needs per conversation, rigid single-option flows create callbacks and abandonments.
Free operators from repetitive questions. Fees, hours, locations, and documents can be handled autonomously, giving time back for complex conversations.
Make cancellation easy. The 9.5% of changes and cancellations is a pool of slots to recover, not a nuisance to discourage.
Differentiate the channels. Chat informs, the phone converts, WhatsApp builds loyalty.
Conclusion
Patients do not call to "book." They call to solve a health problem, and the booking is how that problem becomes concrete. Along the way they bring questions about cost, doubts about hours, established habits and, sometimes, the need to hear a human voice.
Measuring these requests means stopping the guesswork about your front desk and starting to know it for real. It is the first step toward a welcome that does not stop at answering, but listens, understands, and resolves, leaving people the time to do what no technology can replace: taking care.
Want to know what your facility's patients ask? Book a call with our team.
Method note: the analysis is based on 2,452 conversations handled by Run2AI Virtual Reception between September 1 and 22, 2026 across several Italian healthcare facilities of different specialties. Each conversation was classified with one or more tags across 19 categories; tag percentages are calculated on the total number of conversations and, because a conversation can carry more than one tag, their sum exceeds 100%.
Frequently asked questions
What is the most frequent request patients make to a healthcare reception?
Booking an appointment, present in 68.3% of the conversations analyzed. The most common combination is booking plus a specialist visit, which alone accounts for 20.3% of all conversations.
Do patients prefer to call or to write?
They prefer to call, by a wide margin. In the sample, 90.8% of conversations happened by phone, 8% via web chat, and 1.2% via WhatsApp.
How many patients ask to speak with a human operator?
An operator request appears in 30.4% of conversations, but it is the only request in just 6.3%. In 79.2% of those cases it comes with a concrete need, such as a booking or a change, which the AI assistant can often handle directly.
Why is a traditional IVR a poor fit for what patients ask?
Because each conversation contains two different requests on average, and 19 request types produced 311 unique combinations in the sample. A keypad menu forces the patient to pick a single option, while a conversational assistant understands and handles compound requests in one interaction.
Related Articles
IVR vs Virtual Reception: Pros and Cons of Managing Medical Front Desk with AI

A practical comparison between traditional IVR and AI Virtual Reception to improve patient experience, front desk efficiency, and operational performance.
Read moreThe AI Paradox: 10 Front Desk Activities With an Increasing Human Touch
Discover how artificial intelligence is redefining the role of healthcare front desks, automating repetitive tasks and enhancing high-touch human activities.
Read more